
Only Mostly Dead
Cash-flowing and asset-rich firms are more likely to engage in successful corporate turnarounds

The turnaround story is one that pulls at the heart strings of value investors. Where the majority see a corpse-like firm destined for the market wastebin, the bottom-feeder and cigar-butt investors among us see what Miracle Max from the film The Princess Bride would call “only mostly dead”. And as Miracle Max points out, “there’s a big difference between mostly dead and all dead – mostly dead is slightly alive”. The value investor’s dream of course is to catch a turnaround at its moment of inflection. Or, to re-frame this idea with a much more relevant quote from Peter Lynch: “When things go from terrible, to semi-terrible, to OK, you can make a lot of money”. Empirical evidence suggests successful turnarounds are more likely to occur among firms that are cash-generative, asset rich, and efficiently translate capital into revenue.
In August 1997, Apple brought back Steve Jobs as interim CEO, marking the beginning of a major restructuring effort. Jobs streamlined the company’s product lineup and secured a $150 million investment from Microsoft to stabilize its operations. Over the ensuing 24 months, Apple’s stock surged, outperforming the market by a cumulative 200%. While the internet bubble likely helped fuel this outperformance, Jobs’ return is now viewed as a pivotal moment that catalyzed Apple’s long-term resurgence. Not all turnaround attempts, however, end in such success. In the summer of 2010, Borders Group launched a last-ditch effort to salvage its business amid declining sales and growing online competition. The company closed underperforming stores, installed new leadership, and made a foray into ‘eBooks’. But the effort fell short; Borders’ stock collapsed, and the company filed for bankruptcy months later. Figure 1 compares the trajectories of these two turnaround stories.
Figure 1: Apple vs. Borders Group Turnaround Attempts, Excess Returns over S&P 500

Source: S&P Capital IQ, PR Newswire, Apple Insider, Countervail Analysis
Was Apple’s rebirth simply a one-off miracle, or were there characteristics in place at the time of the turnaround announcement that would have predicted its successful outcome? To understand the drivers of both successful and unsuccessful turnaround attempts, I built a dataset of 830 unique turnaround events spanning the years 1993 – 2024. I used natural language to comb through earnings call transcripts and news media to identify companies that had publicly announced turnaround or restructuring plans. I flagged these companies at the time of the turnaround announcement and then further grouped each event into one of five categories, shown here in figure 2.
Figure 2: Turnaround Categories and Distribution of Events

Source: Countervail
I classified each of these turnarounds as either ‘successful’ or ‘unsuccessful’ based on whether they beat the market (positive excess returns over the S&P 500) over the 24 months following the announcement of the turnaround. Importantly, 118 turnaround attempts resulted in bankruptcy. I then pulled down a panel of accounting data that would have been available at the time of the announcement to differentiate between successes and failures. The accounting-based predictor variables can be thought of as representing the pre-conditions and available levers that would have either facilitated or thwarted the subsequent turnaround effort.
I trained a model to learn the relationship between accounting-based predictor variables and historical turnaround outcomes. Figure 3 displays the coefficients for the 15 variables most strongly associated with turnaround success. Positive values indicate that higher values of the variable increase the odds of success. More precisely, each coefficient reflects how a one standard deviation increase in that variable affects the log-odds of a successful turnaround. The three most influential predictors are a company’s ability to generate cash (operating cash flow relative to total assets), the scale of its asset base (log of total assets), and the combined impact of capital efficiency and operational productivity (return on capital multiplied by asset turnover).
Figure 3: Top 15 Predictor Variables for Turnarounds

Sources: S&P Capital IQ, Countervail Analysis
Endnotes: [1], [2], [3]
The odds for a successful turnaround are increasing in cash-based profitability, suggesting that strong internal cash generation likely makes turnaround objectives more operationally tractable. Turnaround odds are also increasing in a company’s total assets; it’s likely that assets provide a buffer against distress and can be monetized if necessary. Finally, firms with both efficient asset utilization and high ROC are more likely to mount successful turnaround initiatives. The interaction of these two variables — asset turnover and ROC — capture how well a company translates capital into revenue and how that revenue then translates into returns. Notably, ‘Capital Structure Fix’ is the strongest categorical predictor and is associated with negative outcomes.
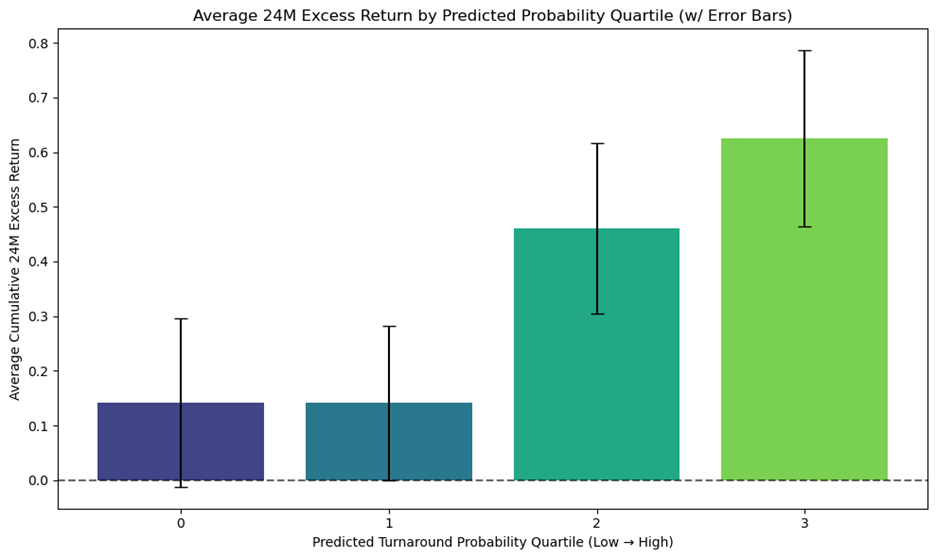
Ultimately, the objective is to use these learned associations to make predictions among unseen turnarounds. Figure 4 shows the average 24-month excess returns by quartile of predicted turnaround success for historical but previously unseen turnaround candidates. The results show a clear upward trend in realized returns as predicted success probability increases, indicating that the model has effectively identified and weighted the variables most predictive of turnaround outcomes. The probability cutoff for inclusion in the top two quartiles, where risk adjusted returns become strongly positive, is 68%. Companies in the top quartile of predicted turnaround success achieved an average 24-month excess return of 60% over the S&P 500. This roughly translates to a 2% monthly alpha.
Figure 4: Average 24-Month Excess Return by Predicted Probability Quartile
Source: S&P Capital IQ, Countervail Analysis
Endnotes: [4], [5]
I then found 8 recently launched or ongoing turnaround campaigns and fed them into this algorithm. Figure 5 details these companies, the nature of their turnaround campaigns, and their predicted probabilities of success. This sample of companies range in their struggles and their proposed plans to address them.
Figure 5: Recent and Ongoing Corporate Turnarounds

Source: S&P Capital IQ, Countervail Analysis
It’s reassuring to see that BP, a current activist target of Elliot Management, has the highest probability of success. And while each turnaround case here has modest odds, the earlier data show that realized returns are meaningfully different for a firm with a 60% predicted probability of success and another with a 70% predicted probability of success. From this sub-sample, only BP and Kohl’s exceed the the 68% probability threshold associated with the potential for positive risk-adjusted alpha. Importantly, I consider these outputs a starting point for further diligence as each of these companies has found itself in the unenviable position of requiring a turnaround campaign for very good reason.
The initial evidence presented here suggests that statistical inference can allow us to more reliably source attractive risk-adjusted opportunities among corporate turnaround candidates. Turnarounds are high dispersion events: Apple’s stock shot up and to the right after bringing back Steve Jobs while Borders’ group plummeted into bankruptcy after it’s eBook flop. Using statistical inference here isn’t a silver bullet, but it can likely help cut off the left tail of the turnaround distribution and avoid the biggest failures. And while this study is conducted with relatively few observations, the results are logical: cash-flowing and asset-rich firms with an operational pulse can capably pursue valuable initiatives. Building this dataset over time will continuously improve the model’s ability to identify promising turnaround campaigns in their early stages.
Nice write up, Johann. Thanks for the quantitative / empirical support